梯度下降算法(Gradient_Descent_Algorithm)
《PyTorch深度学习实践》- 刘二大人p3
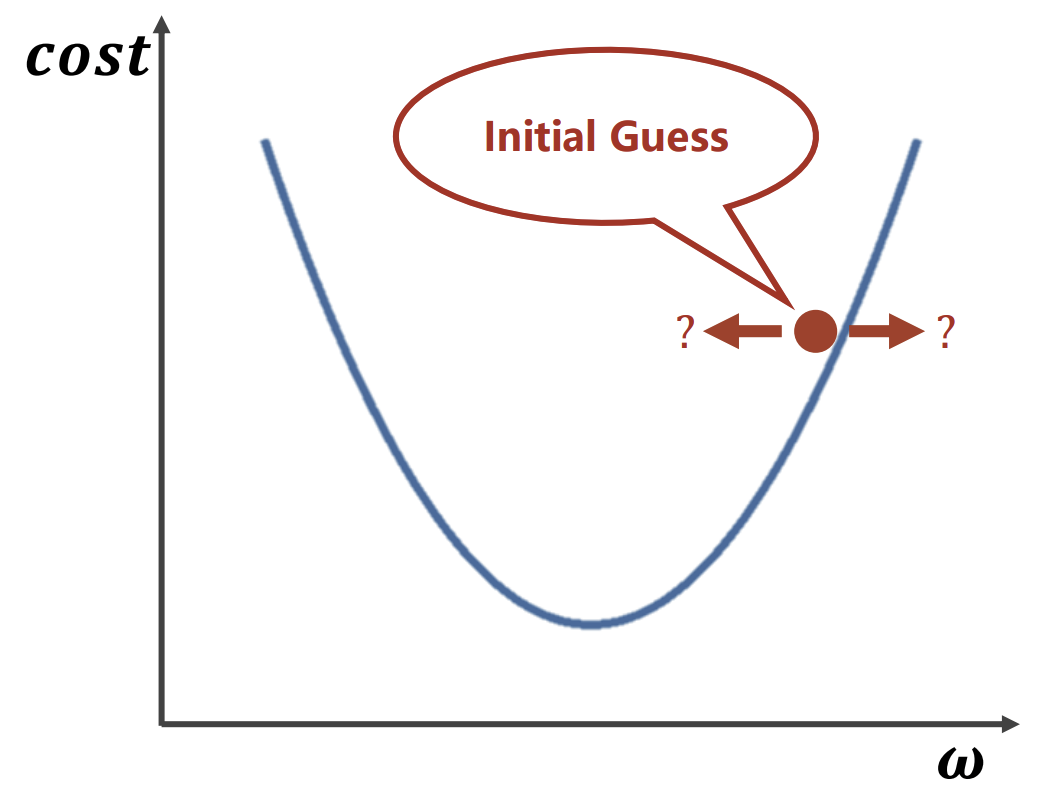
红点的x轴取值为一开始ω随机取值,曲线最低点为实际最优点,那此时ω该取左边或右边(取小或大一点值)呢?可使用梯度下降算法。
梯度下降算法:
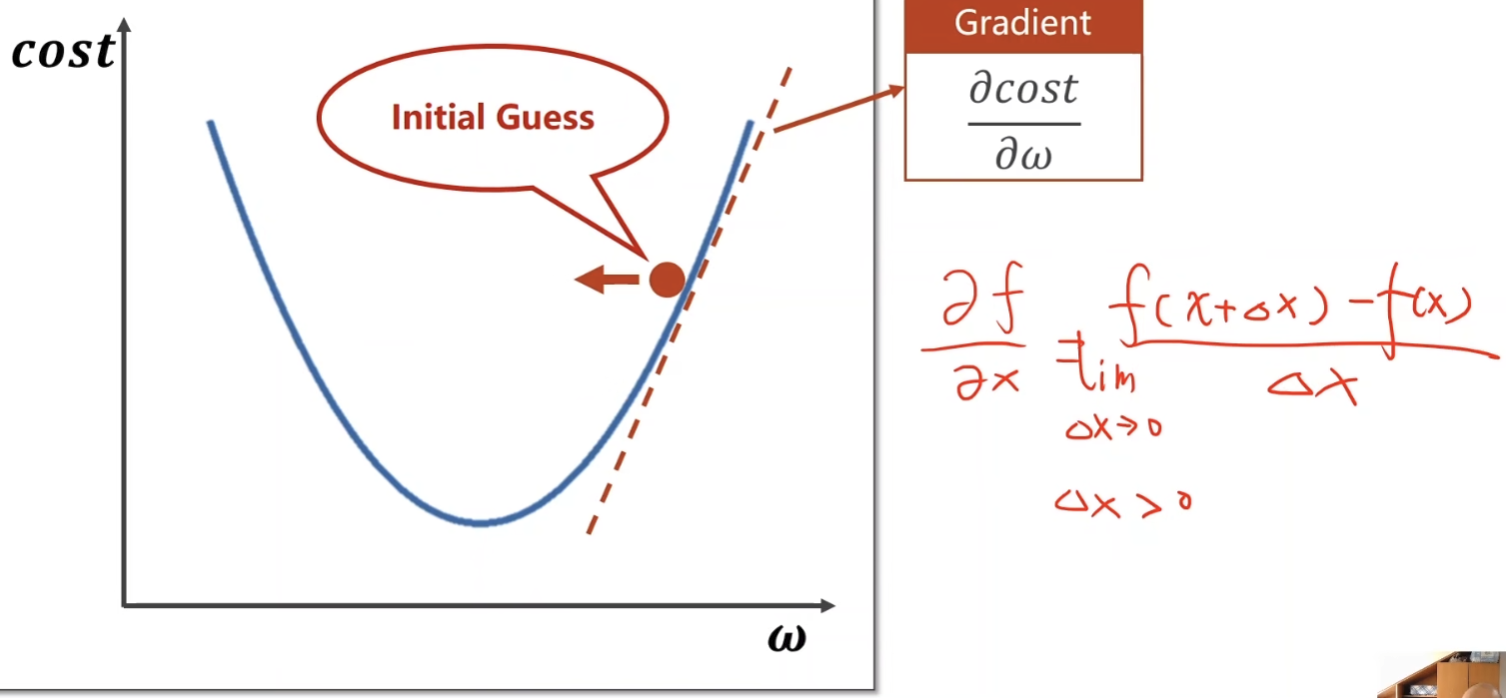
对红点处求导,导数大于0,则说明该点右侧是向上增加的,导数小于0,则说明该点右侧是向下递减的,则w下一次取小点的数。
更新权重w:
公式:

w:权重
α:学习率 (不要取大了,不然w也会跟着取太大了)
缺点:只能找到局部最优点,而不是全局最优点。
对下面这种非凸函数,w取值可能会靠向红点凹处(称为局部最优点),而离实际的最低点还差很多。
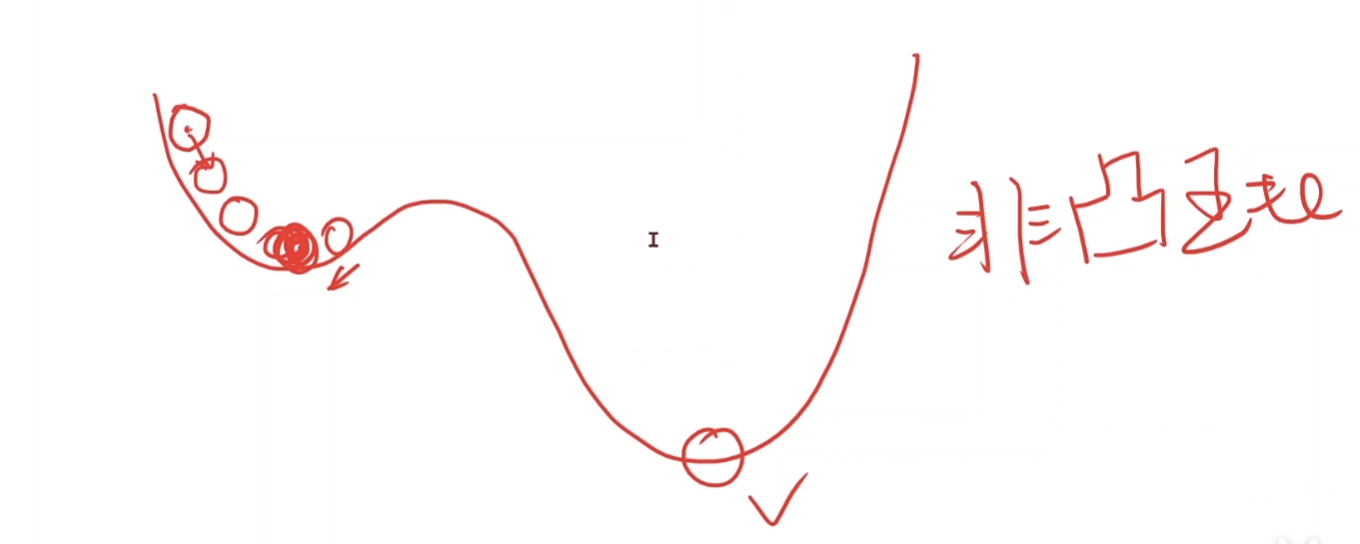
特殊:导数(梯度)等于0。此处公式无法使用。
鞍点:

该点处即是最小点,又是最大点。
公式简化:
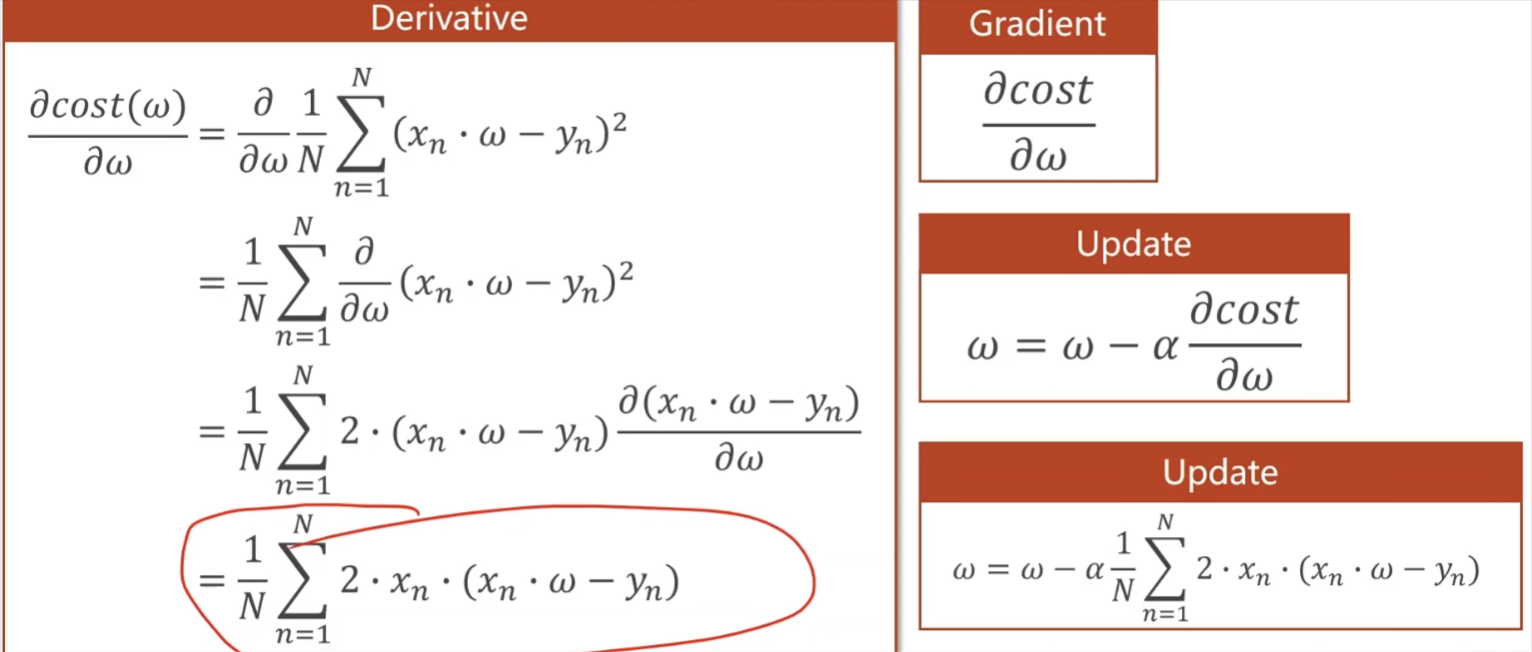
红圈为梯度,Update即为最新公式。
代码:
1
2
3
4
5
6
7
8
9
10
11
12
13
14
15
16
17
18
19
20
21
22
23
24
25
26
27
28
29
30
31
32
33
34
35
36
37
38
39
40
41
42
43
44
45
46
47
48
| import numpy as np
import matplotlib.pyplot as plt
x_data = [1.0, 2.0, 3.0]
y_data = [2.0, 4.0, 6.0]
w = 1.0
def forward(x):
return x * w
def cost(xs, ys):
cost = 0
for x, y in zip(xs, ys):
y_pred = forward(x)
cost += (y_pred - y) ** 2
return cost/ len(xs)
def gradient(xs , ys):
grad = 0
for x, y in zip(xs, ys):
grad += 2 * x * (x * w - y)
return grad / len(xs)
cost_list = []
epoch_list = []
print('Predict (before trraining)', 4 , forward(4))
for epoch in range(1000):
epoch_list.append(epoch)
cost_val = cost(x_data, y_data)
cost_list.append(cost_val)
grad_val = gradient(x_data, y_data)
w -= 0.01 * grad_val
print('Epoch:', epoch, 'w=', w, 'cost=', cost_val)
print('Predict (after training', 4, forward(4))
plt.plot(epoch_list, cost_list)
plt.ylabel('Cost')
plt.xlabel('Epoch')
plt.show()
|
结果图:
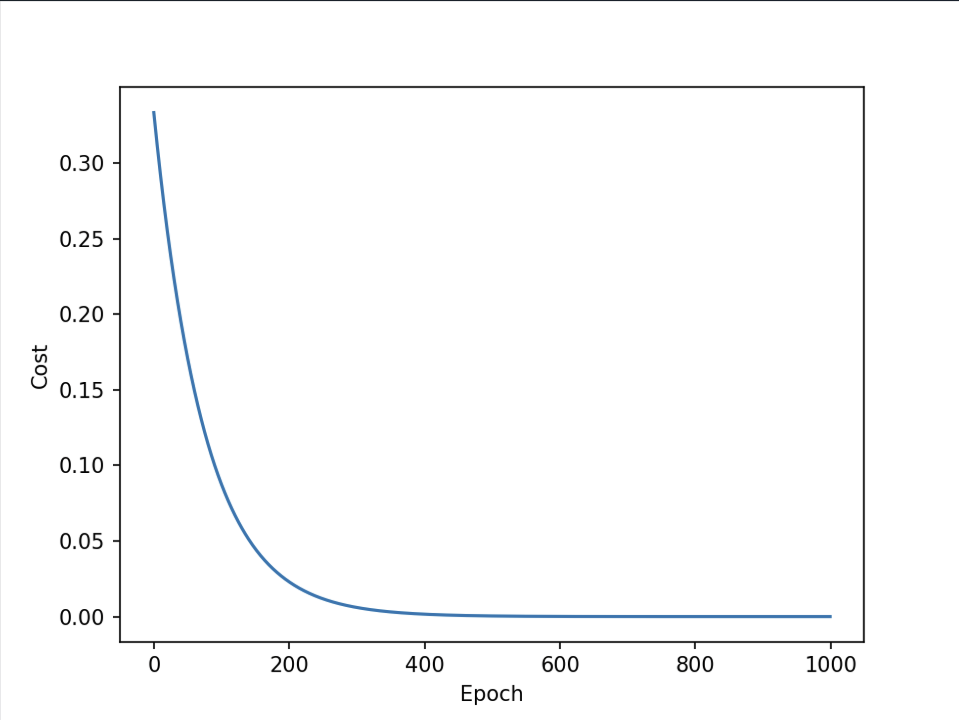
正确的,cost趋近于0。如果后面还抬上去了,变成凹函数,说明训练发散了,可能α取太大了,而不是最低点是最优点。
改进版:随机梯度下降算法(SGD)
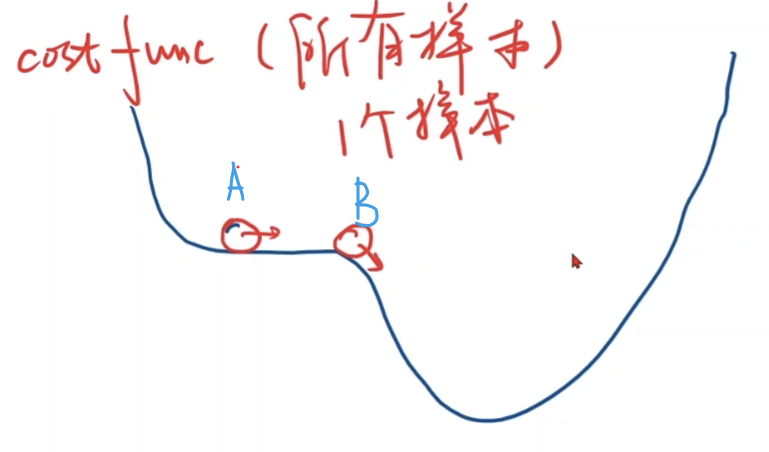
使用原因:
1、上面算法是取了一个样本,可能最终到A点后就停止了(如上面训练1000此后w接近2,不再变化),但此处并不是最低点,使用随机在所有样本取点,可能训练后到B点,再训练后继续前进到达最低点!
2、大样本学习时,若采用所有样本的的损失,计算量太大,训练很久。
代码:
1
2
3
4
5
6
7
8
9
10
11
12
13
14
15
16
17
18
19
20
21
22
23
24
25
26
27
| x_data = [1.0, 2.0, 3.0]
y_data = [2.0, 4.0, 6.0]
w = 1.0
def forward(x):
return x * w
def loss(x, y):
y_pred = forward(x)
return (y_pred - y) ** 2
def gradient(x, y):
return 2 * x * (x * w - y)
print('Predict (before trraining)', 4 , forward(4))
for epoch in range(1000):
for x, y in zip(x_data, y_data):
grad = gradient(x, y)
w -= 0.01 * grad
print("\tgrand:", x, y, grad)
l = loss(x, y)
print('progress:', epoch, 'w=', w, 'loss=', l)
|


