线性模型(Linear_Model)
《PyTorch深度学习实践》- 刘二大人p2
流程:
1、DataSet
2、Model
3、Training
4、Inferring
本节例子:

表格数据即为数据集(DataSet)
橙色数据为训练集(TrainingSet)
蓝框数据为测试集(TestSet)
为保证训练效果,拿训练集后,一部分拿来训练,一部分拿来验证2,即验证集(ValidationSet)
本题先不考虑验证集
1、选择模型
先选择线性模型,看效果如何(线性模型简单)
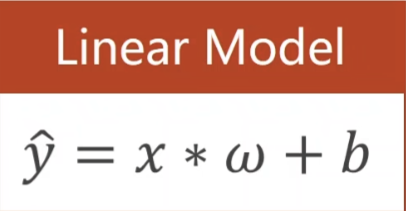
先简化下模型,即把b去了,y=x*ω
结果为:
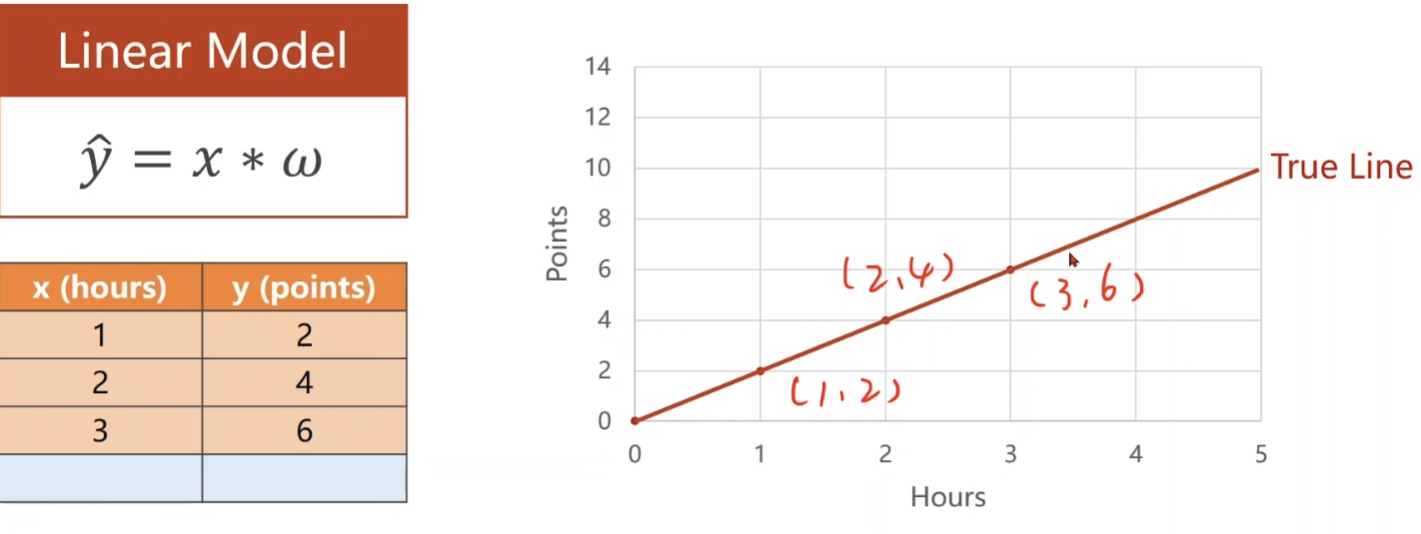
难点:ω取多少?
ω先取一个随机值(如ω=3),输入x值后得到y,y和真实的y值作比较,越靠近(平均损失Mean Loss越小),ω越正确,方法为求损失函数(Loss)
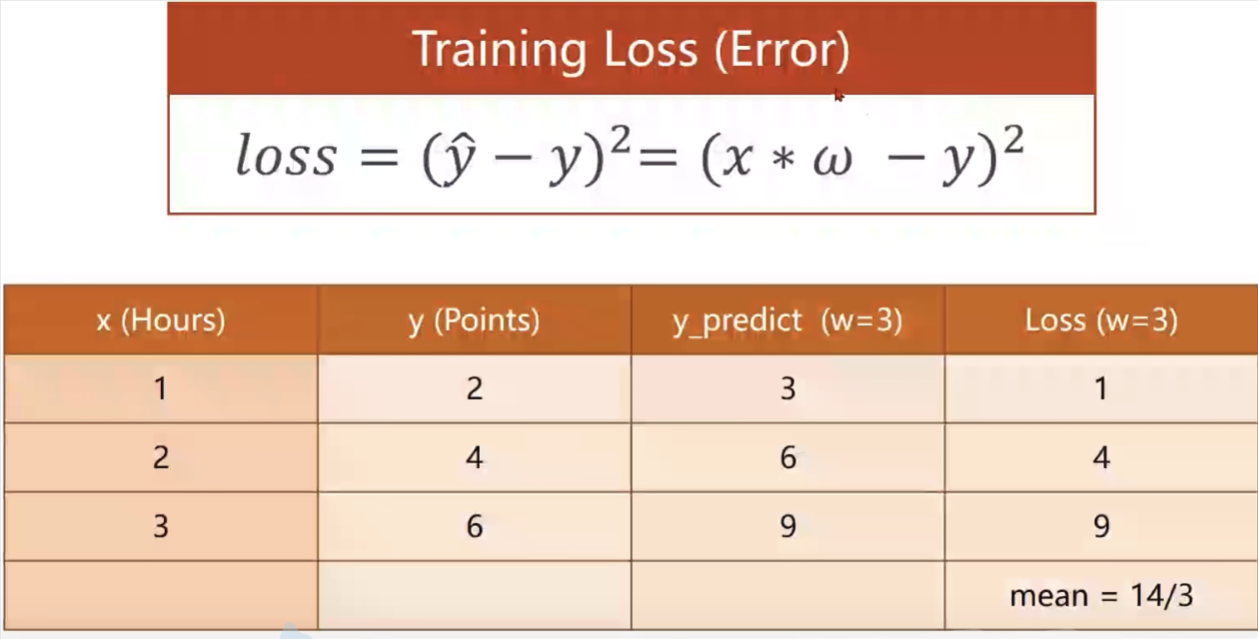
即ω=3时,mean loss = 14/3
w=4时,mean loss = 56/3
w=2时,mean loss = 0
注意:
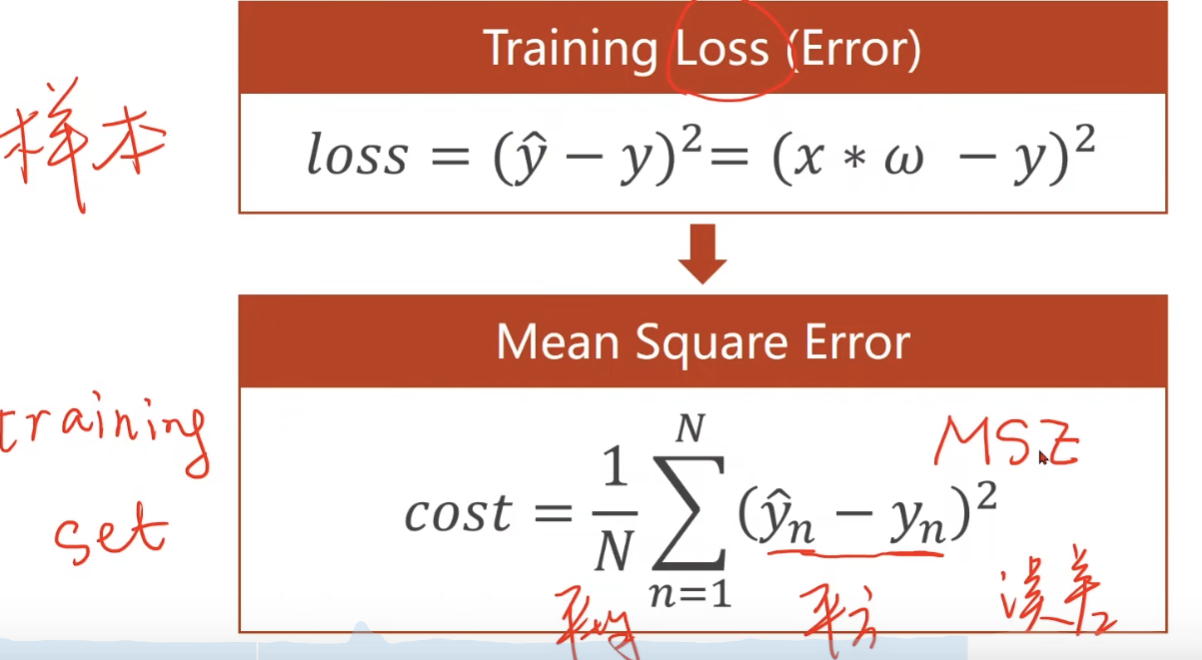
本表格有3个样本的数据(此题N=3),求的是loss,还要求整个训练集所有的样本,称平均平方误差MSE(Mean Square Error),如图:
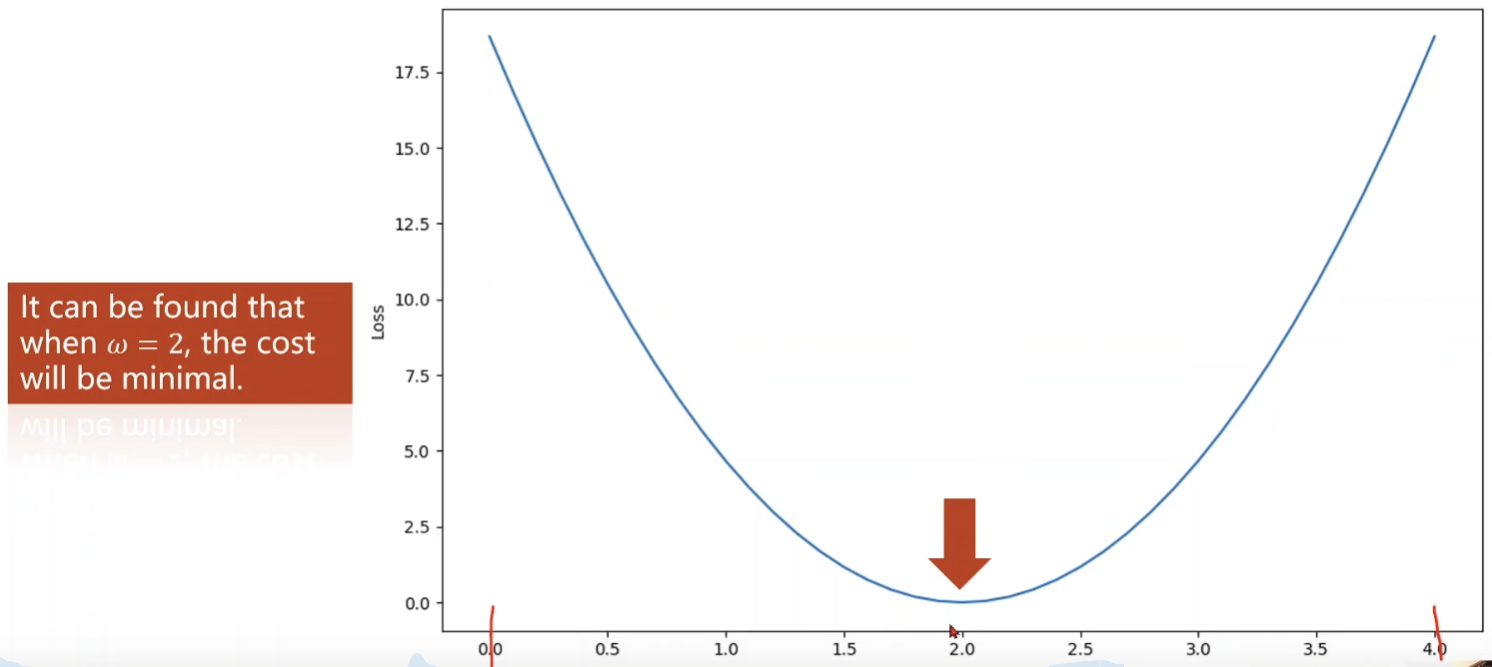
穷举法算权重w,如图,最低点为loss最小,最优点:
实现代码:
1
2
3
4
5
6
7
8
9
10
11
12
13
14
15
16
17
18
19
20
21
22
23
24
25
26
27
28
29
30
31
32
33
34
35
36
37
38
39
| import numpy as np
import matplotlib.pyplot as plt
x_data = [1.0, 2.0, 3.0]
y_data = [2.0, 4.0, 6.0]
w_list = np.arange(0.0, 4.1, 0.1)
b_list = np.arange(-2.0, 2.1, 0.1)
w, b = np.meshgrid(w_list, b_list)
def forward(x):
return x * w + b
def loss(x, y):
y_pred = forward(x)
return (y_pred - y) * (y_pred - y)
mse_list = []
for x_val, y_val in zip(x_data, y_data):
l_sum = 0
y_pred_val = forward(x_val)
loss_val = loss(x_val, y_val)
l_sum += loss_val
print('MSE=', l_sum / 3)
mse_list.append(l_sum / 3)
fig=plt.figure()
ax = fig.add_subplot(projection='3d')
ax.plot_surface(w, b, mse_list[0],
rstride=1,
cstride=1,
cmap=plt.get_cmap('rainbow'))
plt.show()
|
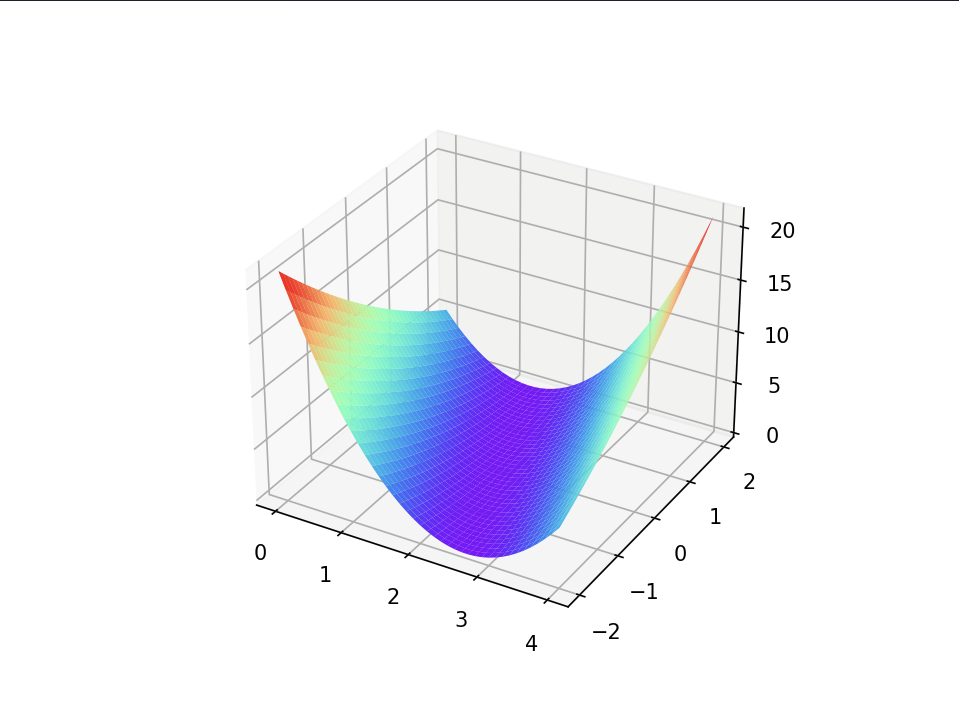
结果图:
xxxxxxxxxx27 1x_data = [1.0, 2.0, 3.0]2y_data = [2.0, 4.0, 6.0]34w = 1.056def forward(x):7 return x * w8910def loss(x, y):11 y_pred = forward(x)12 return (y_pred - y) ** 21314def gradient(x, y):15 return 2 * x * (x * w - y)161718print(‘Predict (before trraining)’, 4 , forward(4))1920for epoch in range(1000): #训练1000次21 for x, y in zip(x_data, y_data):22 grad = gradient(x, y)23 w -= 0.01 * grad24 print(“\tgrand:”, x, y, grad)25 l = loss(x, y)2627 print(‘progress:’, epoch, ‘w=’, w, ‘loss=’, l)python
作业:
把b加上
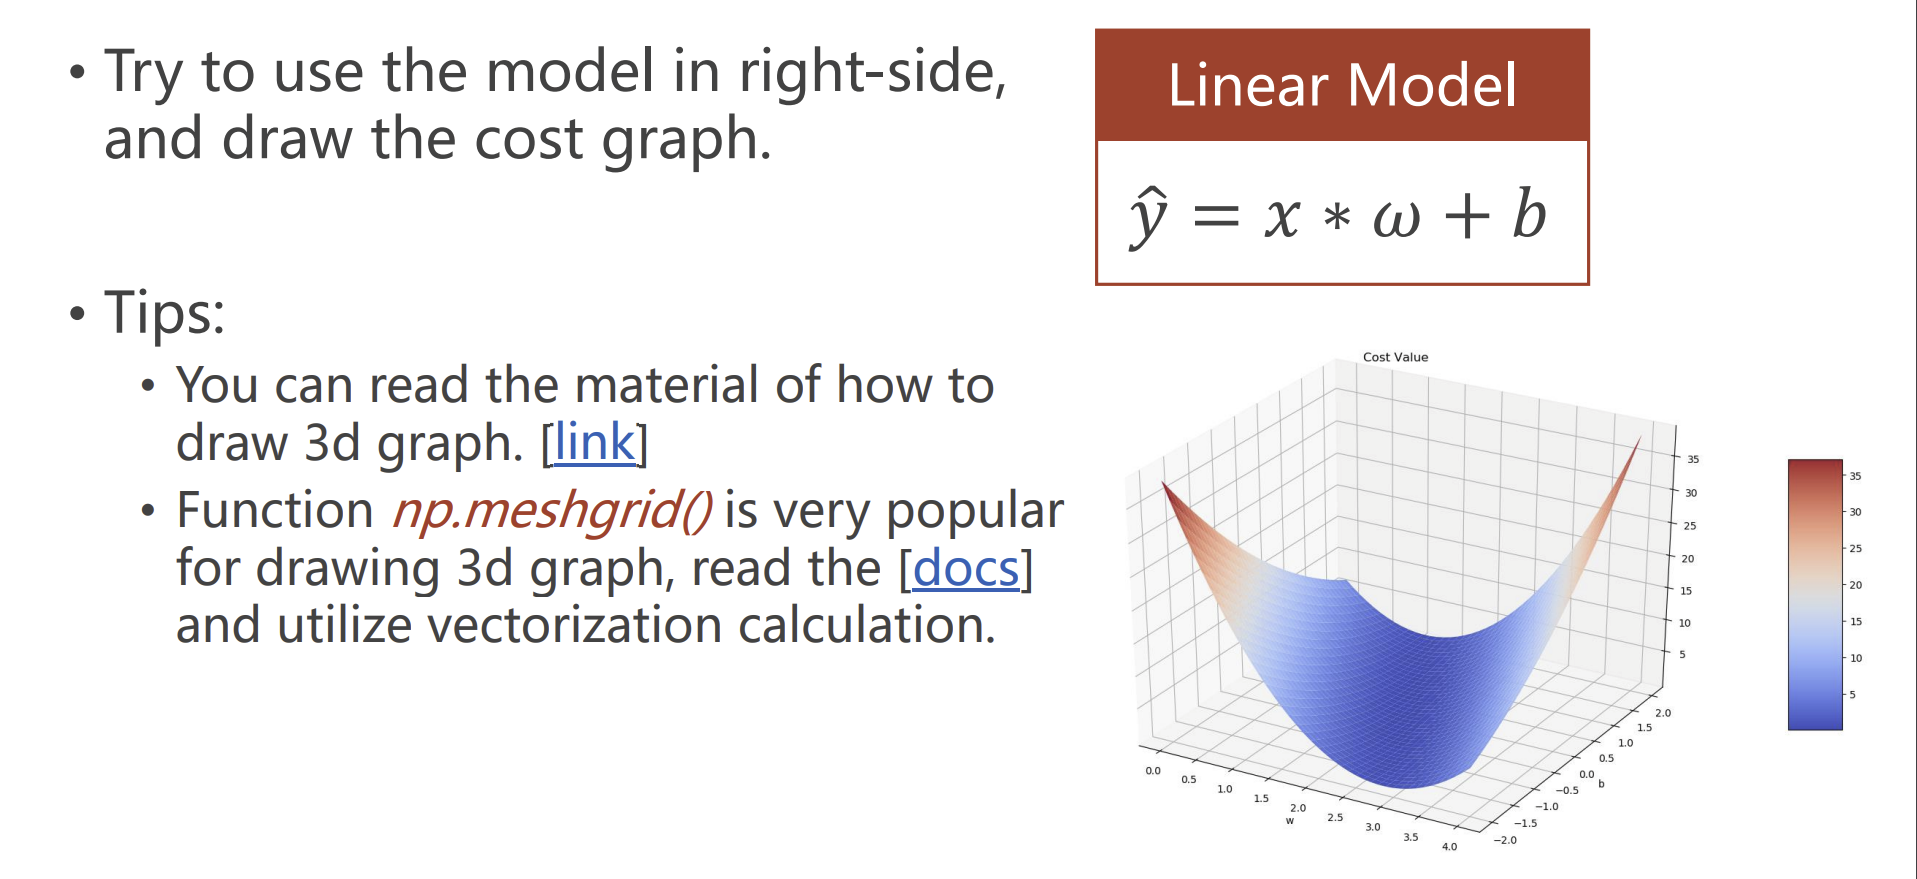
所以x轴为w,y轴为b,z轴为mse。
代码:
1
2
3
4
5
6
7
8
9
10
11
12
13
14
15
16
17
18
19
20
21
22
23
24
25
26
27
28
29
30
31
32
33
34
35
36
37
38
39
| import numpy as np
import matplotlib.pyplot as plt
x_data = [1.0, 2.0, 3.0]
y_data = [2.0, 4.0, 6.0]
w_list = np.arange(0.0, 4.1, 0.1)
b_list = np.arange(-2.0, 2.1, 0.1)
w, b = np.meshgrid(w_list, b_list)
def forward(x):
return x * w + b
def loss(x, y):
y_pred = forward(x)
return (y_pred - y) * (y_pred - y)
mse_list = []
for x_val, y_val in zip(x_data, y_data):
l_sum = 0
y_pred_val = forward(x_val)
loss_val = loss(x_val, y_val)
l_sum += loss_val
print('MSE=', l_sum / 3)
mse_list.append(l_sum / 3)
fig=plt.figure()
ax = fig.add_subplot(projection='3d')
ax.plot_surface(w, b, mse_list[0],
rstride=1,
cstride=1,
cmap=plt.get_cmap('rainbow'))
plt.show()
|
